Benchmarking Kafka vs Chronicle for Microservices: which is 750 times faster?
Apache Kafka is a common choice for inter-service communication. Kafka facilitates the parallel processing of messages and is a good choice for log aggregation. Kafka claims to be low latency, high throughput. However, is Kafka fast enough for many microservices applications in the cloud?
When I wrote Chronicle Queue Open Source my aim was to develop a messaging framework with microsecond latencies, and banks around the world have adopted it for use in their latency-sensitive trading systems.
In this article, I will describe how Kafka does not scale in terms of throughput as easily as Chronicle Queue for microservices applications. As a teaser, I will show you this chart showing that Chronicle Queue is around 750 times faster even for lower throughput.
Visualising delay as a distance
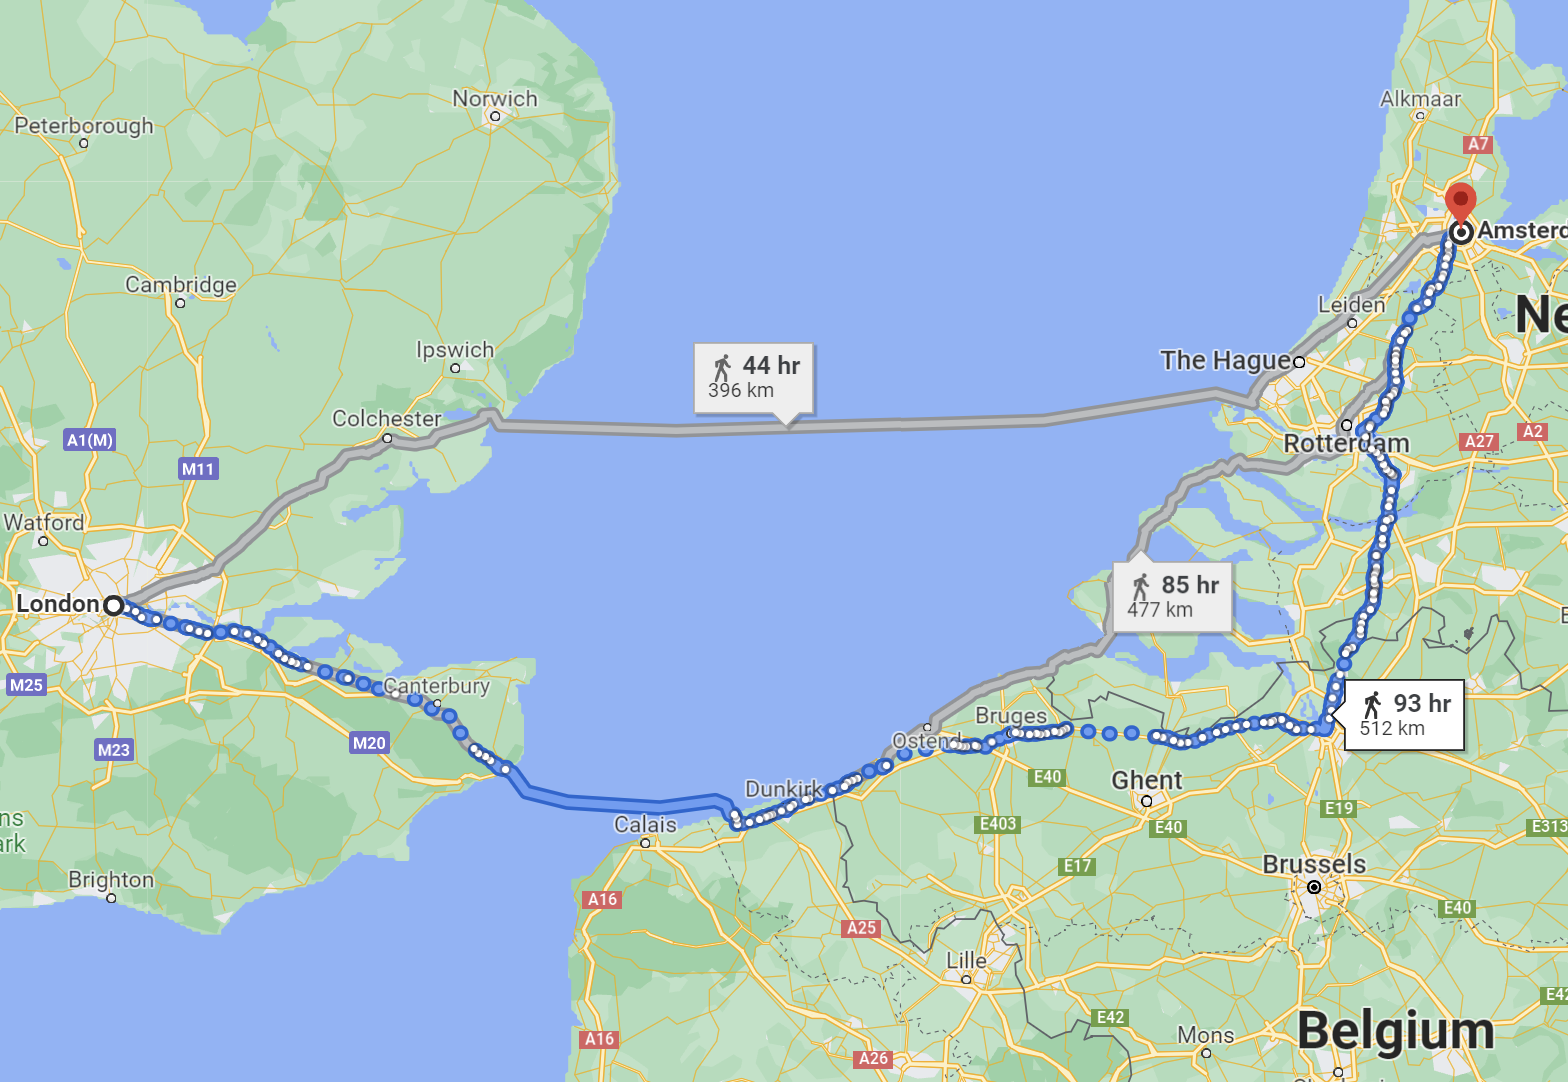
In order to illustrate the difference, let me start with an analogy. Light travels through optic fibre and copper at about two thirds the speed of light in a vacuum, so to appreciate very short delays, they can be visualised as the distance a signal can travel in the time. This can really matter when you have machines in different data centres.
Microservice latency using Chronicle
The 99%ile single microservice end-to-end latency for Chronicle Queue Enterprise at 500 kmsg/s was 3.69 microseconds or about a 10-minute walk in central London.

Microservice latency using Kafka
Using Kafka for the same test, but at a lower throughput of 100 kmsg/s the 99%ile single-stage microservice end-to-end latency was around 2633 microseconds (from 150kmsg/s, the latencies increase dramatically) This is the time it takes a signal to travel 526 km, a distance of about the same as walking from London to Amsterdam.
Log Aggregation
Kafka was originally designed for log aggregation. It has many connectors and for this use case, it does an excellent job. I measured good results which show using Kafka to replace writing to log files in a typical system could improve performance as well as give significantly more manageability. https://docs.confluent.io/cloud/current/client-apps/optimizing/latency.html
Test Scenarios
In each case, the same test hardness was used. Everything was deployed onto a Ryzen 9 5950X running Ubuntu 21.04. The same MP600 PRO XT 2TB M.2 NVMe drive was used in all tests. The source for the benchmark is available here. https://github.com/OpenHFT/Microservice-Benchmark
- Chronicle Queue open-source v5.22ea14 writing at 500 k messages/second, using Chronicle Wire for serialization. Single producer (and a single consumer downstream)
-Dworkload=500kps.yaml chronicle.yaml
- Chronicle Queue Enterprise v2.22ea72 writing at 500 k messages/second, using Chronicle Wire for serialization, Single producer in Asynchronous buffer mode (and a single consumer downstream)
-Dworkload=500kps.yaml chronicle-async.yaml
- Kafka 3.0.0 with Jackson writing JSON at 100 k message/second in high throughput latency configuration (primarily linger.ms=1) Four partitions and eight consumers
-Dworkload=100kps.yaml kafka.yaml
- Kafka 3.0.0 with Jackson writing JSON at 250 k message/second in high throughput latency configuration (primarily linger.ms=1) Four partitions and eight consumers. -Dworkload=250kps.yaml kafka.yaml
Notes
The number of partitions and consumers were selected which produced the best latencies 99.99% of the time.
For Chronicle Queue, the performance of 100 kmsg/s or 500 kmsg/s was much the same so I included the 500 kmsg/s results. One publisher, one consumer and one microservice were used.
Benchmarking Kafka at 500kmsg/s messages resulted in messages queuing, with latencies increasing the longer the benchmark ran. I.e. a 2-minute burst resulted in a typical latency of close to 1 minute.
For Kafka to process 250kmsg/s messages, at least four were needed, and a benchmark with eight is reported here as this produced a better result. My understanding is this is a recommended scaling technique for Kafka.
The low latency configuration (linger.ms=0) failed for throughputs over 25 kmsg/s from a single producer.
Publish Latency
As can be seen, the typical latency to publish is comparable. However, the outliers are much higher. Depending on the use case, the performance difference might not matter, and the typical publish latency across tests was no more than 2.6 microseconds.

In each case, the same event is published which is 512 bytes long as JSON. Two fields were added to trace when the message was sent.

Microservice Messaging Transport
While the time to publish, or the time to send/receive a pre-serialized message can be a good comparison of messaging solutions, this is only a piece of the puzzle. For microservices, you need to know from the time you have a DTO describing the event to process until a downstream consumer reads the resulting DTO from the original microservice.
For a microservices benchmark, we look at the time to send the same event as above, end to end.
- Add a high-resolution timestamp (System.nanoTime())
- Serialize the first message
- Publish the first message
- Consume the first message
- Deserialize the first message
- Call the microservice
- Add a second high-resolution timestamp
- Serialize the second message on another topic/queue
- Publish the second message
- Consumer the second message
- Deserialize the second message.
- Record the end to end latency
How does Kafka Perform in Their Published Benchmarks?
While publishing events on Kafka typically takes single-digit microseconds, the end to end transport can take milliseconds.
Confluent published a benchmark that is one-hop but includes replicated messaging. They report 99 percentile (worst 1 in 100) latencies of 5 milliseconds for an end to end time.
https://www.confluent.io/blog/kafka-fastest-messaging-system/
In our benchmark, we have two hops, serialization and deserialization, all on one host. I expect that for 100k msg/s out and 100k msg/s returned we should get a similar delay as 200 k msg/s over a single hop.
End to End Latency
It’s hard to illustrate how much lower latency Chronicle exhibits compared to Kafka, so in the series of charts below, each chart also has a zoomed out version at 10x the scale of the previous one.
Latencies up to 100 microseconds
With the same scale as we had before, it can be seen that Chronicle Queue Enterprise has consistent latencies even across two hops including serialization. Chronicle Queue open-source performs much the same, most of the time, however, it has much higher latencies. Chronicle Queue Enterprise includes specific features (over open source) to better control outliers. You can’t see Kafka in this chart as the latencies are all much higher.

Latencies up to 1000 microseconds
The chart below has a 10x scale, and it can be seen that while Chronicle Queue has higher outliers they are reasonably consistent up to the 99.99 percentile. Kafka is yet to appear.

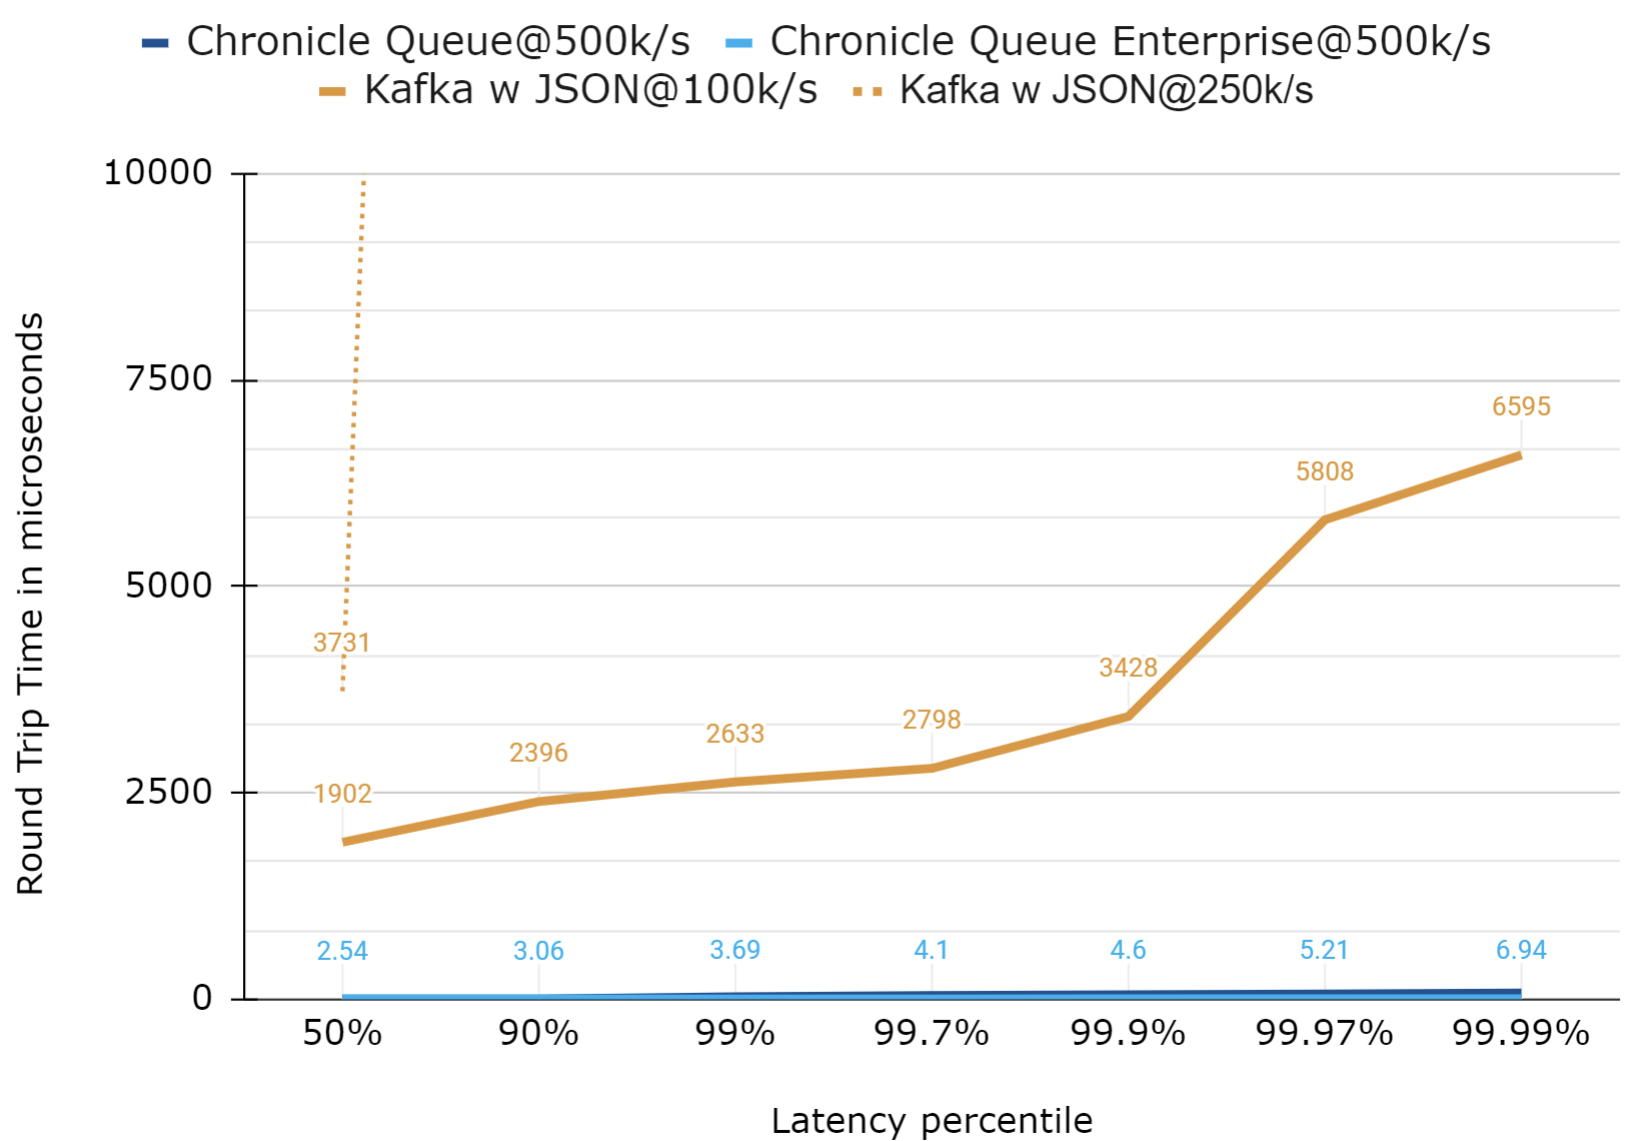
Latencies up to 10,000 microseconds
The chart below has a scale again made 10x larger. In this scale, not much detail can be seen for the Chronicle benchmarks, but the typical latencies for two of the Kafka configurations now appear. In particular, it can be seen that the 99% latency for 100 kmsg/s (200kmsg/s total) is around 2,630 microseconds, similar to the 5 milliseconds for Confluent's benchmark.
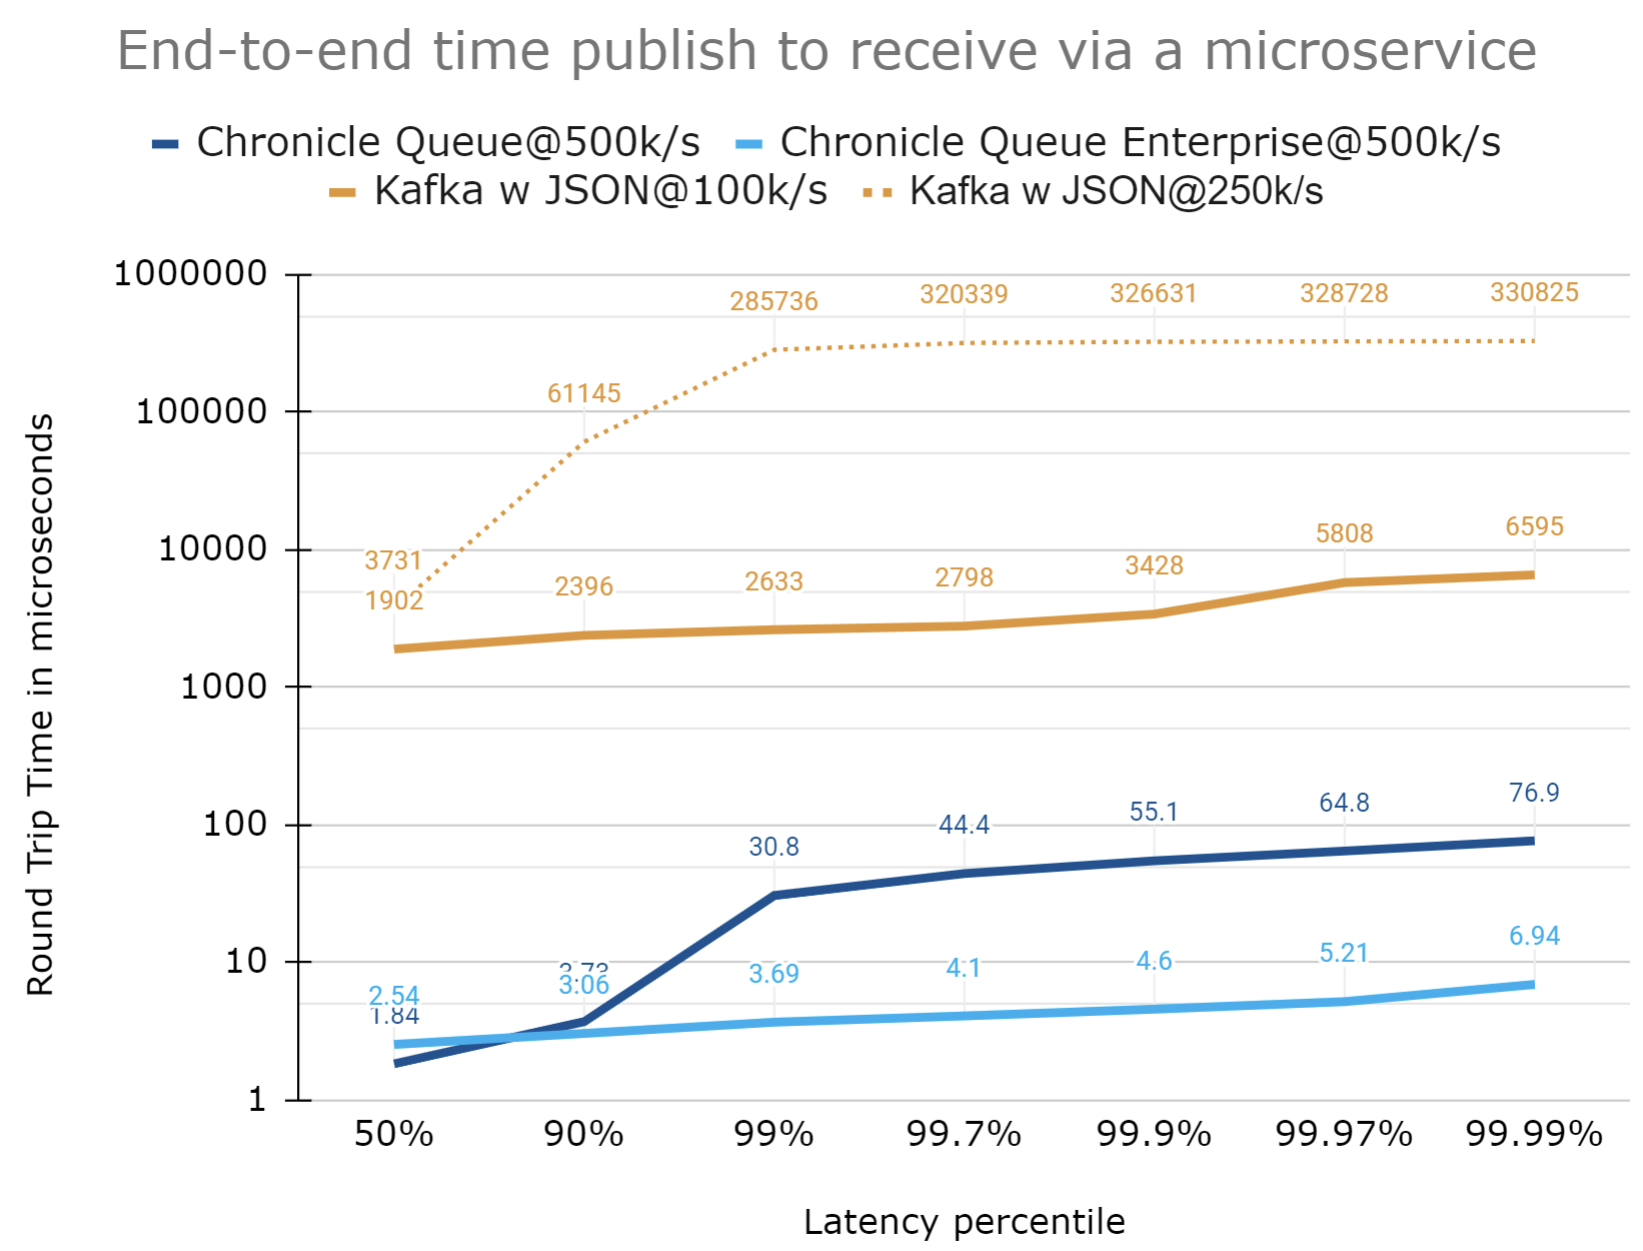
Using a logarithmic scale for the latencies
With a large range of values, it can be useful to use a logarithmic scale. While this can be more readable, it can be harder to appreciate how different the latencies are as many people are not used to reading logarithmic scale charts.
How much higher are the latencies?
Another way to visualise just how much higher the latencies are for Kafka is to plot the ratio of latencies between Kafka and Chronicle. The chart below is a plot of the ratio of latencies between Kafka@100 kmsg/s which is one of the best results, and Chronicle Queue Enterprise@500kmsg/s ie at 5x the load.
Kafka is consistently at least 680x slower for this benchmark, even for one-fifth of the throughput.
For Kafka to achieve its lowest latencies with a 100 kmsg/s throughput, four partitions and eight microservices were used, however Chronicle Queue only needed one in all cases.

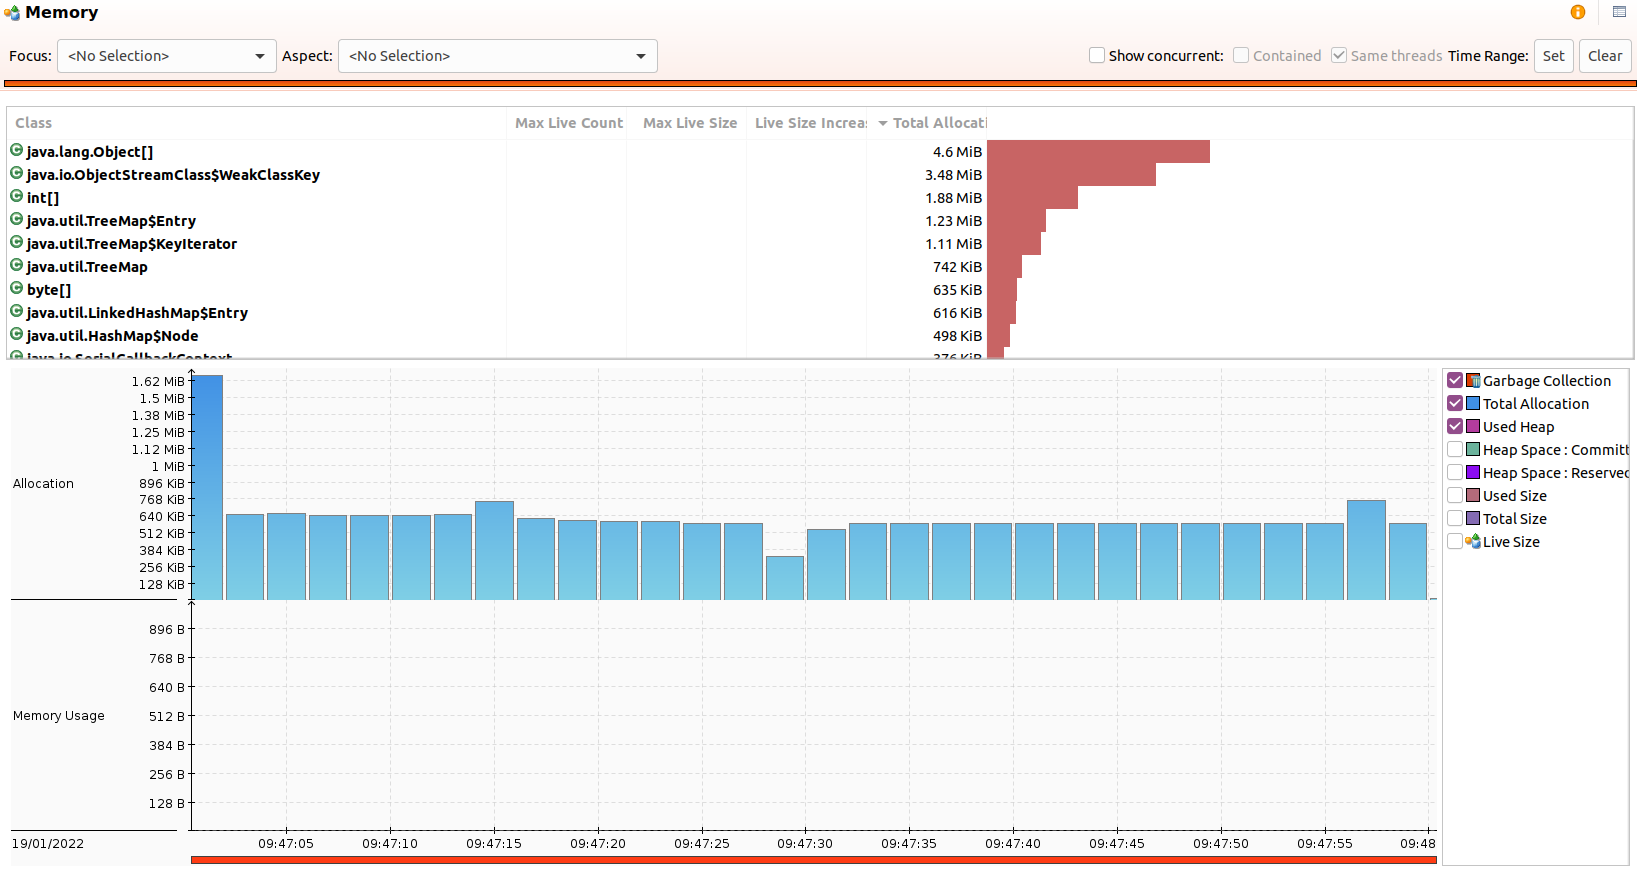
Chronicle Queue Heap Usage
The Chronicle Queue benchmark with 500 k/s messages for 5 minutes (300 million messages total), used a peak heap size of 40 MB with the G1 collector and default GC parameters. The benchmark runs with a 32 MB heap. No GCs occurred after warm-up.
NOTE: Most of the garbage is from the Flight Recorder doing its job and Chronicle Queue doesn’t use the standard Java serialization features.
Kafka memory usage
The Kafka benchmark of 250 k/s messages for 10 minutes (300 million messages total), used a peak of 2.87 GB of the heap and triggered 2,410 young pause collections, and 182 concurrent cycle collections after warm-up.
This can be run with a 128 MB heap size but results in over 139k GCs which is sub-optimal. In this recording, the heap size was set to 1 GiB.

Conclusion
While Kafka is a good choice for log aggregation, it might not be low latency enough for many use cases involving microservices due to its relatively high end-to-end latencies.
Chronicle Queue open-source achieves consistent latencies below 100 microseconds more than 99.99% of the time while Kafka had outliers of 7 ms even at 1/5th of the throughput.
Chronicle Queue Enterprise has additional features to keep latencies more consistent with latencies of below 10 microseconds more than 99.99% of the time.

Why not to use log scale on Y axis?
ReplyDeleteTo put kafka off the scale?
I did include an chart with a logarithmic Y scale, but only after the linear the charts
DeleteInteresting comparison. I think it might make sense to add a benchmark with Kafka + Chronicle Wire in order to compare the actual Kafka logic, dismissing the JSON overhead (which I assume to be significant).
ReplyDeleteMaybe I will try this for myself one day :-)
Jackson is pretty efficient. The biggest difference is the size of the messages. I wanted to compare how Kafka is typically used to how Chronicle is typically used, even then Kafka is typically used in a cluster which is not how it is used in this benchmark. The time to publish gives a good idea of the overhead of serialization.
Delete