Posts

Showing posts with the label Benchmarks

Why You Should Tune Code Before Your Garbage Collector

Image
Optimising your memory allocations in Java could make far more difference than your choice of Garbage Collector and may even change which is the best garbage collector. In this post I look at a simple event to response latency benchmark, MarketDataSnapshot to NewOrderSingle at 50K/s for 30 minutes using JLBH to test Chronicle-FIX. The goal is to compare a system which is doing redundant work (in this case logging each message using SLF4J), compared with not logging (Chronicle-FIX records every message internally using Chronicle Queue) and how this changes the choice of Garbage Collector For the p99 (worst 1 in 100) the choice of Garbage Collector makes a different on par with optimising how loggin is done However, for the p99.99 (worst 1 in 10,000) optimsing how the logging is done is orders of magnitude more signifciant than the choice of Garbage Collector Unoptimised Benchmark This takes the optimised benchmark and adds one SLF4J log line of just ...

Testing Java Memory Management with Chronicle-FIX using AI

Image
While I am sceptical of using AI for release code, it has plenty of uses that previously weren’t practical, such as determining how easy your software is to use. If an AI can “figure it out” with a few hints, then you are on the right track. For me, the value of AI is what you learn using it. For more Techincal Information on Chronicle-FIX What AI Does Well and What It Doesn’t Claude and Codex are effective for producing idiomatic code; for low-latency code, it needs a significant body of example code. In this case, it was able to utilise sample code for benchmarks. If it was being used to write business logic, it would need the code to be mostly complete examples, and then it could write variations on that. If you were starting, it would be better to either; a) get it to write something functionally correct with the expectation you would rewrite it again manually, or b) write the code yourself and use AI to assist you in improving it. The AI Benchmark Trial I ga...

Trivially Copyable Objects in Java

TL;DR Problem: Java’s standard serialisation can be slow due to scattered object fields and reflection-based overhead. Approach: Emulate C++-style trivially copyable objects by restricting fields to primitives, enabling bulk memory copies. Result: Near C++-like serialisation performance, dramatically reducing latency and improving throughput. Trade-offs: Requires careful design, limited flexibility, and testing for JVM compatibility. Outcome: Low-latency systems with high performance, suitable for financial data feeds, real-time analytics, and other latency-sensitive domains. Introduction For low-latency systems, every microsecond has tangible business impact. In high-frequency trading, real-time analytics, and similarly time-sensitive workloads, even minor inefficiencies in serialisation and deserialisation can degrade throughput and responsiveness. The seemingly mundane act of converting objects into bytes and back often becomes a performance bottleneck. Thi...

Efficient Distributed Unique Timestamp Identifier Generation

Distributed unique timestamp identifiers provide a powerful means of generating globally unique, human-readable 64-bit values at sub-microsecond speeds. By embedding a host identifier directly into a nanosecond-resolution timestamp, you gain a simple, chronologically sortable, and intuitive scheme for correlating events across multiple hosts. This approach offers significant benefits in latency-sensitive systems where even small delays can become expensive at scale. Introduction In a world of horizontally scaled microservices, ensuring that each event or message receives a unique identifier across multiple machines can be challenging. Traditional approaches often rely on UUIDs, which—while easy to use—lack intuitive readability and can be relatively expensive to generate in ultra-low-latency scenarios. Our solution builds upon nanosecond-resolution timestamps combined with a host identifier embedded directly into the lower-order digits of the timestamp. This technique, ...

Performance Tip: Rethinking Collection.toArray(new Type[0])

Image
Introduction Have you ever considered the performance implications of converting collections to arrays in Java? It's a common task; your chosen method can impact your application's efficiency. In this article, I will explore different approaches to toArray() , benchmark their performance, and determine which method is optimal for various scenarios. The Challenge Converting a Collection to an array seems straightforward, but the standard practice of using collection.toArray(new Type[0]) might not be the most efficient. Understanding the nuances of this method can help you write more performant code. Exploring the Approaches Let's delve into four primary methods and a combination for converting collections to arrays: 1. Using toArray() Without Arguments Object[] array = { "Hello", "world" }; String[] strings = (String[]) array; // Throws ClassCastException at runtime While this approach avoids additional array creation and can be fast, it ...

Storing 1 TB in Virtual Memory on a 64 GB Machine with Chronicle Queue

Image
As Java developers, we often face the challenge of handling very large datasets within the constraints of the Java Virtual Machine (JVM). When the heap size grows significantly—often beyond 32 GB—garbage collection (GC) pause times can escalate, leading to performance degradation. This article explores how Chronicle Queue enables the storage and efficient access of a 1 TB dataset on a machine with only 64 GB of RAM. The Challenge of Large Heap Sizes Using standard JVMs like Oracle HotSpot or OpenJDK, increasing the heap size to accommodate large datasets can result in longer GC pauses. These pauses occur because the garbage collector requires more time to manage the larger heap, which can negatively impact application responsiveness. One solution is to use a concurrent garbage collector, such as the one provided by Azul Zing , designed to handle larger heap sizes while reducing GC pause times. However, this approach may only scale well when the dataset is within the available main ...

How SLOW can you read/write files in Java?

A common question on Stack Overflow is: Why is reading/writing from a file in Java so slow? What is the fastest way? The discussion often revolves around comparing NIO versus IO . However, the bottleneck is usually not the read/write operations themselves, and the specific approach often has little significance in the bigger picture. To demonstrate, I’ll show one of the simplest (and perhaps slowest) ways to read/write text, using PrintWriter and Files.lines(Path) . The code is available here While it’s slower than writing binary using NIO or IO , it’s fast enough for most typical use cases. Example Output The program on a Ryzen 5950X running Linux outputs: Run 1, Write speed: 0.900 GB/sec, read speed 0.832 GB/sec Run 2, Write speed: 0.918 GB/sec, read speed 1.208 GB/sec Run 3, Write speed: 0.933 GB/sec, read speed 1.197 GB/sec If you find that 900 MB/s is more than fast enough for your application, the specific method of reading/wri...

Java is Very Fast, If You Don’t Create Many Objects

Image
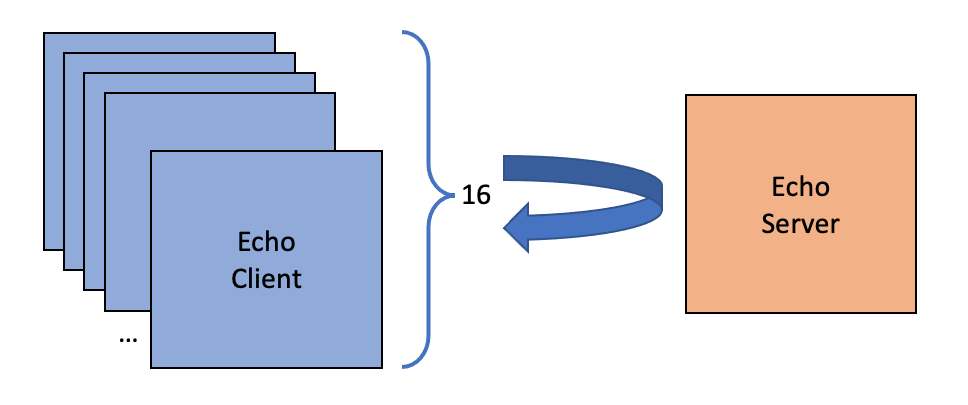
  You still have to watch how many objects you create. This article looks at a benchmark passing events over TCP/IP at 4 billion events per minute using the net.openhft.chronicle.wire.channel package in Chronicle Wire and why we still avoid object allocations..  One of the key optimisations is creating almost no garbage. Allocation is a very cheap operation and collection of very short-lived objects is also very cheap. Does this really make a difference? What difference does one small object per event (44 bytes) make to the performance in a throughput test where GC pauses are amortised? While allocation is as efficient as possible, it doesn’t avoid the memory pressure on the L1/L2 caches of your CPUs and when many cores are busy, they are contending for memory in the shared L3 cache.  Results Benchmark on a Ryzen 5950X with Ubuntu 22.10. JVM Vendor, Version No objects Throughput, Average Latency* One object per event Throughput, Average Latency* Azul Zulu 1.8.0_322 60.6 ...