Java is Very Fast, If You Don’t Create Many Objects
You still have to watch how many objects you create.
This article looks at a benchmark passing events over TCP/IP at 4 billion events per minute using the net.openhft.chronicle.wire.channel package in Chronicle Wire and why we still avoid object allocations..
One of the key optimisations is creating almost no garbage. Allocation is a very cheap operation and collection of very short-lived objects is also very cheap. Does this really make a difference? What difference does one small object per event (44 bytes) make to the performance in a throughput test where GC pauses are amortised?
While allocation is as efficient as possible, it doesn’t avoid the memory pressure on the L1/L2 caches of your CPUs and when many cores are busy, they are contending for memory in the shared L3 cache.
Results
Benchmark on a Ryzen 5950X with Ubuntu 22.10.
* Across 16 clients, an event is sent in both directions. The Average Latency = 2 * 16 / throughput
One extra object for each event adds 166 ns or so. This doesn’t sound like much; however, in a high throughput context, this can reduce performance by 25%.
The default behaviour for reading events in Chronicle WIre is to reuse the same object for the same event type every time on deserialization. This provides a simple object pooling strategy to avoid allocations. If this data is retained across method calls, it must be copied.
NOTE: The total time spent in GC was about 170 milliseconds per minute or 0.3% of the time. It is the allocations rather than the time to clean up these very short-lived objects that takes time.
A benchmark of creating short-lived TopOfBook objects across multiple CPUs, produces a similar result. This suggests that the rate new objects can be allocated is quickly saturated for even a small proportion of cores, increasing the average latency with more threads. This is for the same small 44-byte objects.
On a Ryzen 5950X with Ubuntu 21.10, Java 17.0.4.1
The benchmarks
They are not directly comparable but confirm that it’s in the same ballpark. See PerfTopOfBookAllocationMain
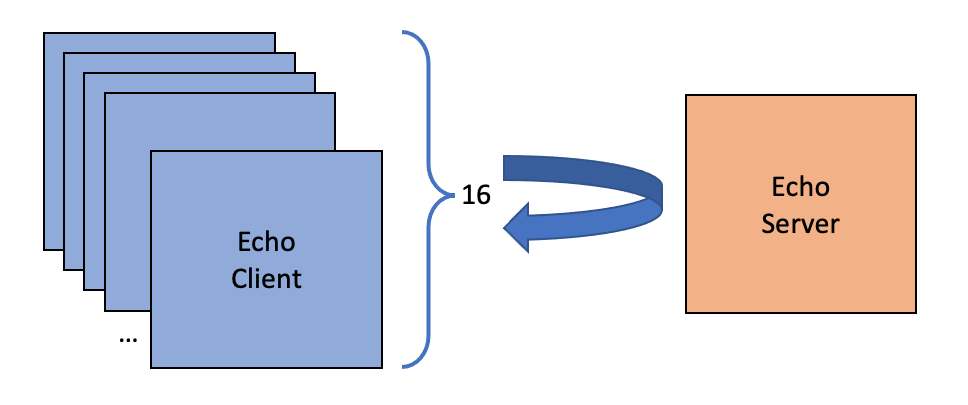
In this benchmark, sixteen clients connect to a simple microservice that takes each event and sends it back again. All events are (de)serialised POJOs with an event type. This translates to an asynchronous RPC call.
public class EchoTopOfBookHandler implements ITopOfBookHandler {
private TopOfBookListener topOfBookListener;
@Override
public void topOfBook(TopOfBook topOfBook) {
if (ONE__NEW_OBJECT)
topOfBook = topOfBook.deepCopy();
topOfBookListener.topOfBook(topOfBook);
}
In this case, deepCopy() creates a new TopOfBook and sets all the fields.
The benchmark can be run in two modes, one where no objects are allocated and one where any object is allocated and initialised, allowing us to measure the difference this makes. Each event is modelled as an asynchronous RPC call to make testing, development and maintenance easier.
public interface TopOfBookListener {
void topOfBook(TopOfBook topOfBook);
}
Low latency software can be very fast but also difficult to work with, slowing development. Using events modelled in YAML we can support Behaviour Driven Development of the microservice.
This is the in.yaml and the out.yaml for the microservice above.
# first top-of-book
---
topOfBook: {
sendingTimeNS: 2022-09-05T12:34:56.789012345,
symbol: EUR/USD,
ecn: EBS,
bidPrice: 0.9913,
askPrice: 0.9917,
bidQuantity: 1000000,
askQuantity: 2500000
}
...
# second top-of-book
---
topOfBook: {
sendingTimeNS: 2022-09-05T12:34:56.789123456,
symbol: EUR/USD,
ecn: EBS,
bidPrice: 0.9914,
askPrice: 0.9918,
bidQuantity: 1500000,
askQuantity: 2000000
}
...
The code
Is available here https://github.com/OpenHFT/Chronicle-Wire/tree/release/2.26/src/test/java/net/openhft/chronicle/wire/channel/book
This library is used in Chronicle Services
Hacker News comments on this article https://news.ycombinator.com/item?id=32807587#32809487
Twitter post on this article https://twitter.com/PeterLawrey/status/1569247849074012160
Conclusion
Java can be very fast, however, it can be well worth avoiding object creation.
The cost of object creation can be far higher than cleaning them up if they are very short-lived.
About your closing comment, how does the benchmark distinguish added creation time vs GC time? Every GC (except Epsilon) has some stop-the-world portion, even ZGC needs to for root marking. I would have thought that this would mean GC always entails some risk of losing a core. And therefore I had assumed that GC would add more delays than allocation.
ReplyDeleteCould you please clarify that point, or point me to a post where you do?
The GC adds bigger delays, and has an impact of the higher percentiles of latency. However in a throughput test it doesn't add up to much. In the benchmark above, it spent 170 ms every minute in a GC. This stops the application 0.3% of the time. By comparison the reduction in throughput due to the allocations slows the throughput by 25%
Delete